I wasn't hired to run Manchester United's marketing. That's what made it interesting.
Or West Ham's. Or Everton's. Or Bournemouth's. The Premier League had its own operation. Every club had its own CRM. Ticketmaster had its own media. Venues had their own channels. Nobody owned the whole journey.
For the 2025 Premier League Summer Series I worked with Relevent Sports Group on marketing performance, data and attribution across three major U.S. markets: MetLife Stadium in New York and New Jersey, Soldier Field in Chicago, and Mercedes-Benz Stadium in Atlanta.
The objective was not to build another marketing dashboard. It was to create enough structure around a decentralized ecosystem that we could begin answering harder questions. Where were ticket buyers coming from? What channels were influencing them? Which campaigns were converting? When were people buying? And could we connect any of that back to actual ticket revenue?
There was no single funnel. There were many.
A fan might see a club social post, visit the Premier League website, receive a team email, search Google several days later, and ultimately purchase through Ticketmaster. Another might discover the event through paid media. Another through a venue. Another through an app, radio, outdoor, PR or a partner.
And ultimately, many of those customers would simply appear in analytics as Direct.
The transaction is easy to see. The journey that created it is much harder.
The problem with attribution at this scale
Start with the data
My first priority was creating as much attribution discipline as the ecosystem would allow. The Premier League and participating clubs controlled their own marketing — I did not dictate their strategies or execute their campaigns. What I could do was build a common measurement structure around them.
That meant prescribing and distributing UTM structures wherever possible, so that participating organizations, media partners, venues and campaigns had a consistent way of identifying traffic. Source. Medium. Campaign. Market. Partner. Placement. Creative. Ticket destination.
The objective was simple: if someone was going to send traffic into the ticket-buying ecosystem, give us the best possible chance of knowing where it came from. It wasn't perfect. But it created something that hadn't existed before — a common language for the data.
Then build the performance picture
The analysis ultimately incorporated Google Analytics, Ticketmaster and TM1, paid search, paid social, programmatic, email and CRM, Premier League channels, club channels, venue channels, promotional codes, registration campaigns, media partners, attendance and ticket scans, transaction-level UTM data, audience research and offline media delivery.
Rather than treating every report as its own answer, I reconciled those sources into a common performance view. Because an impression isn't a ticket. A click isn't revenue. A platform conversion isn't necessarily a transaction. And a platform claiming credit for a sale doesn't necessarily mean it created the demand.
Those distinctions became important.
On-sale was game day
March 13 — the primary on-sale Thursday — was one of the clearest signals in the entire dataset. Soldier Field sold roughly 19,668 tickets that day. MetLife 13,672. Mercedes-Benz 11,289. Around 44,629 tickets in a single window, representing between 24% and 40% of total volume depending on the venue.
The implication was significant. An on-sale isn't simply another campaign date. It should be treated like an event itself. Build anticipation before it. Coordinate communications around it. Create urgency during it. Retarget immediately afterward.
Then we learned people also wait
About half of sales occurred more than 120 days out. But roughly 35% came during the final 30 days, 18–24% within the final six days, and even event day itself accounted for 4–5% of venue sales.
That changed how I think about event marketing investment. There isn't one conversion window. There are several. Launch captures intent. The middle builds confidence. The final weeks convert urgency. Budgets should be structured accordingly.
Search was a closer. Email was better.
High-intent paid search through Ticketmaster: generated 11,660 tickets at a 16.9x return on spend.
The lesson wasn't that search created all of that demand. In many cases it was capturing demand other marketing had already built. But that is exactly why understanding a channel's role in the funnel matters. Some channels create demand. Some reinforce it. Some close it. Search was exceptionally good at closing it.
Ticketmaster Premium Email did better still: generated 1,952 tickets at a 24.8x return on spend. During a July conversion push, Gmail produced more than 3,300 conversions at a fraction of the cost of Meta or TikTok as direct-response closers.
Which reinforced something I have believed for a long time. The database matters. Acquiring attention is expensive. Being able to communicate directly with someone who has already demonstrated intent is enormously valuable.
Creative matters too
The paid registration campaign generated roughly 24,437 registrations against a target of about 23,333. But looking beneath the platform total uncovered a more useful lesson.
Static Meta creative dramatically outperformed video: 21,857 registrations versus 1,560 — at roughly a third of the cost per registration.
That's why I don't like reporting that says "Meta performed well." The useful question is what within Meta performed well, and why. Platform. Audience. Creative. Message. Market. Timing. Offer. Those are the variables that turn reporting into strategy.
The biggest finding was also the biggest opportunity
After the transaction data was cleaned and secondary attribution applied, approximately 90% of identified revenue sat within owned, earned, direct, organic, email and partner classifications. Less than 10% could be directly assigned to paid channels.
Someone could read that as "paid marketing didn't matter very much." I don't believe that's what the data says. I think it exposed the fundamental limitation of traditional attribution.
A fan sees an advertisement Monday. Receives a team email Tuesday. Searches Thursday. Returns directly to Ticketmaster Friday. And the transaction reads Direct.
The revenue was captured. But much of the journey that created it was gone.
Why the finding mattered more than the number
What I would build next
The 2025 series gave a very good view of what happened. The next evolution is a system capable of understanding more completely why — persistent attribution across first touch, last non-direct touch, paid media, CRM, club and venue marketing, Ticketmaster, organic search, partner traffic, offline media, promo codes, creative, transactions and attendance. Rather than letting a customer become "Direct" simply because that was their final visit.
It also means moving beyond attribution toward incrementality. Not asking which channel received credit for a sale, but asking: would the sale have happened without it?
The earlier version of this problem
At Indy Eleven I faced the same question at a much smaller scale — we could only verify 6% of the media we were buying, and getting that to 63% changed how the club allocated budget. That story is here. The difference is scope: verifying what you bought is a discipline you can impose on yourself. Attributing what worked across organizations you do not control is a different problem, and it needs a shared language before it needs a dashboard.
What transfers
I didn't own every marketing channel. That wasn't the assignment. What I helped build was the connective tissue between them — a measurement framework across a global sports property where the league, clubs, venues, Ticketmaster, agencies and partners were all contributing independently to the same commercial outcome.
- Create a common language before you create a dashboard. UTM discipline across independent partners was the unglamorous work that made everything else possible.
- Separate media delivery from commercial performance. A platform claiming credit is not evidence it created demand.
- Find the windows. On-sale day and the final fortnight behave nothing like the months between them.
- Ask what within a channel worked. "Meta performed well" is not a finding.
I've spent a lot of my career at the intersection of fans, experiences, marketing, revenue and data. The numbers are valuable — but only when they help explain human behavior. Why did someone care? What made them act? What finally made them buy? And what should we do differently next time?
Marketing gets more valuable when you can prove what it actually did.
The belief this project reinforced
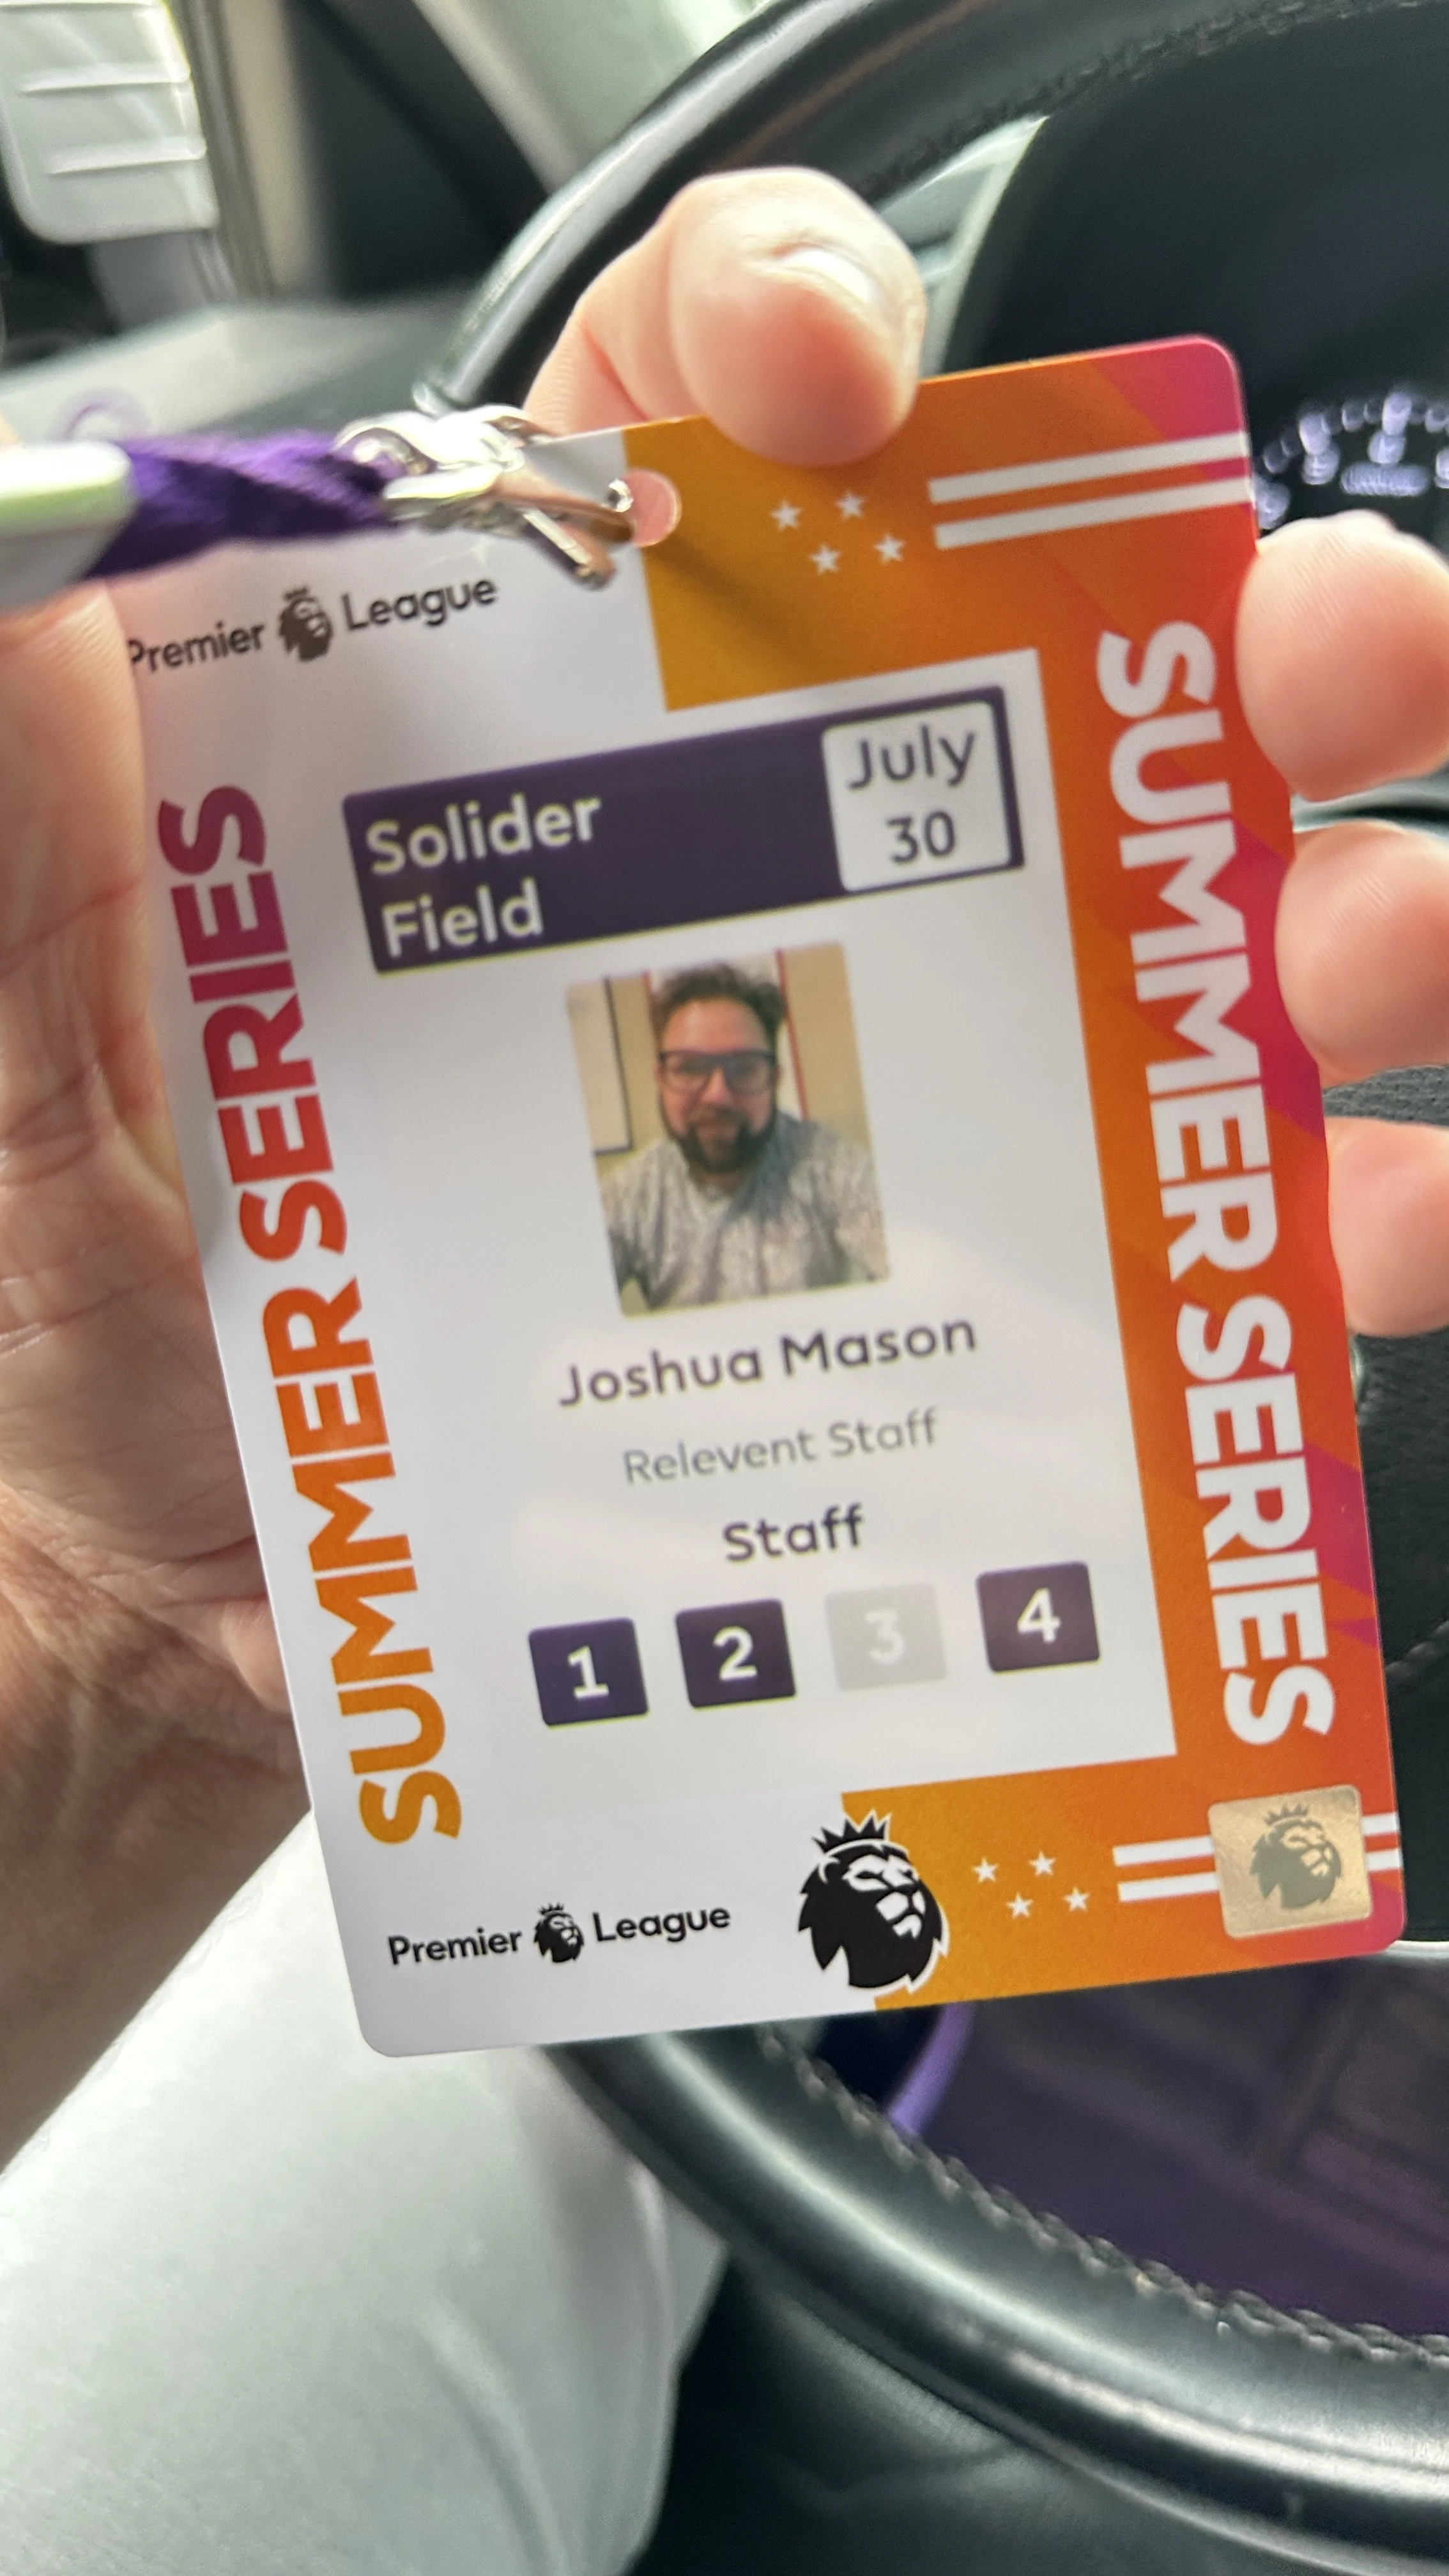

2025 Premier League Summer Series.
Can you prove what your marketing actually did?
Most organizations can show you activity. Fewer can connect it to revenue and defend the connection.
